
From paper reports in a helicopter to ML forecasting: How we built a closed B2G ecosystem for U.S. government departments
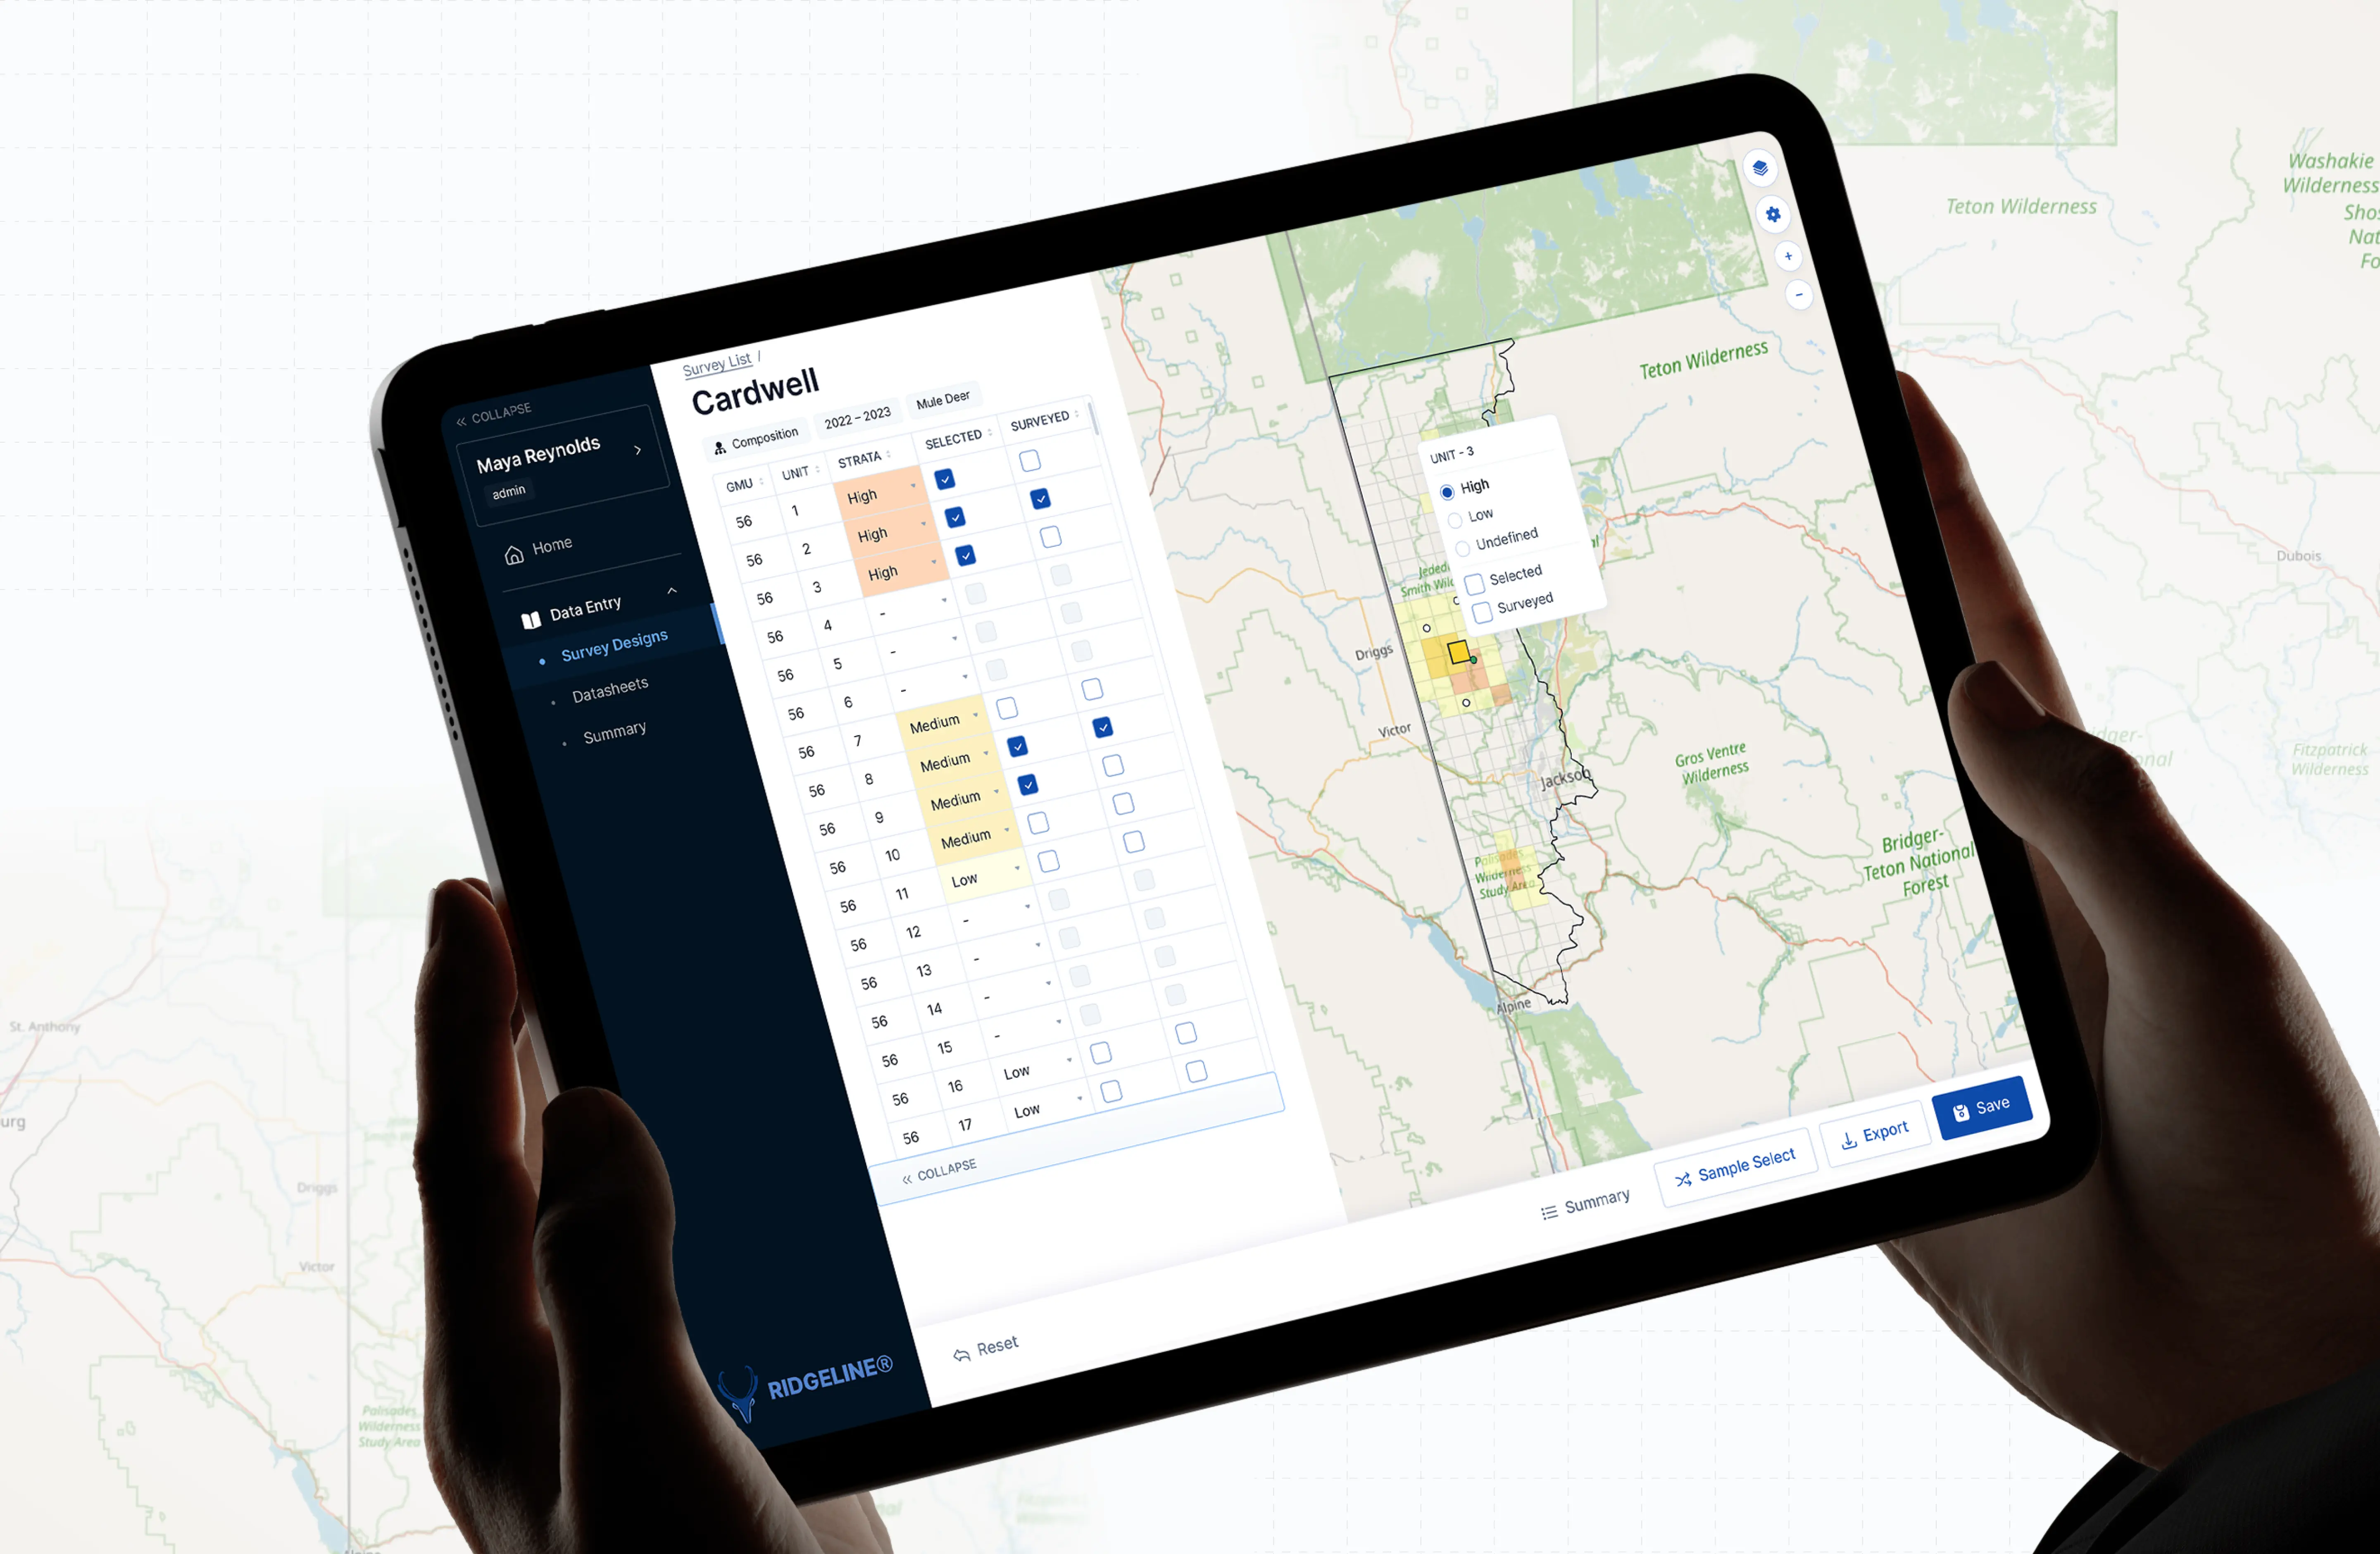
From simple migration to wildlife population management
Our team acts as a bridge between technology and government, providing analytical software to state Wildlife Departments across the U.S.
The main goal of the product is to accurately track the population, migration, and demographics of wild animals (deer, elk, bears, lynxes, etc).
Why is this important? Based on the collected data, government agencies make critical legal decisions: setting quotas, issuing hunting permits, or completely banning the hunting of certain species. A miscalculation can lead to an ecological imbalance.
The product is a completely closed B2B/B2G ecosystem. Access is granted on an individual basis, exclusively after signing a contract. What started in 2021 as a two-month database migration project has evolved today into a massive system of web applications, mobile solutions for aerial surveys, and complex analytical tools.
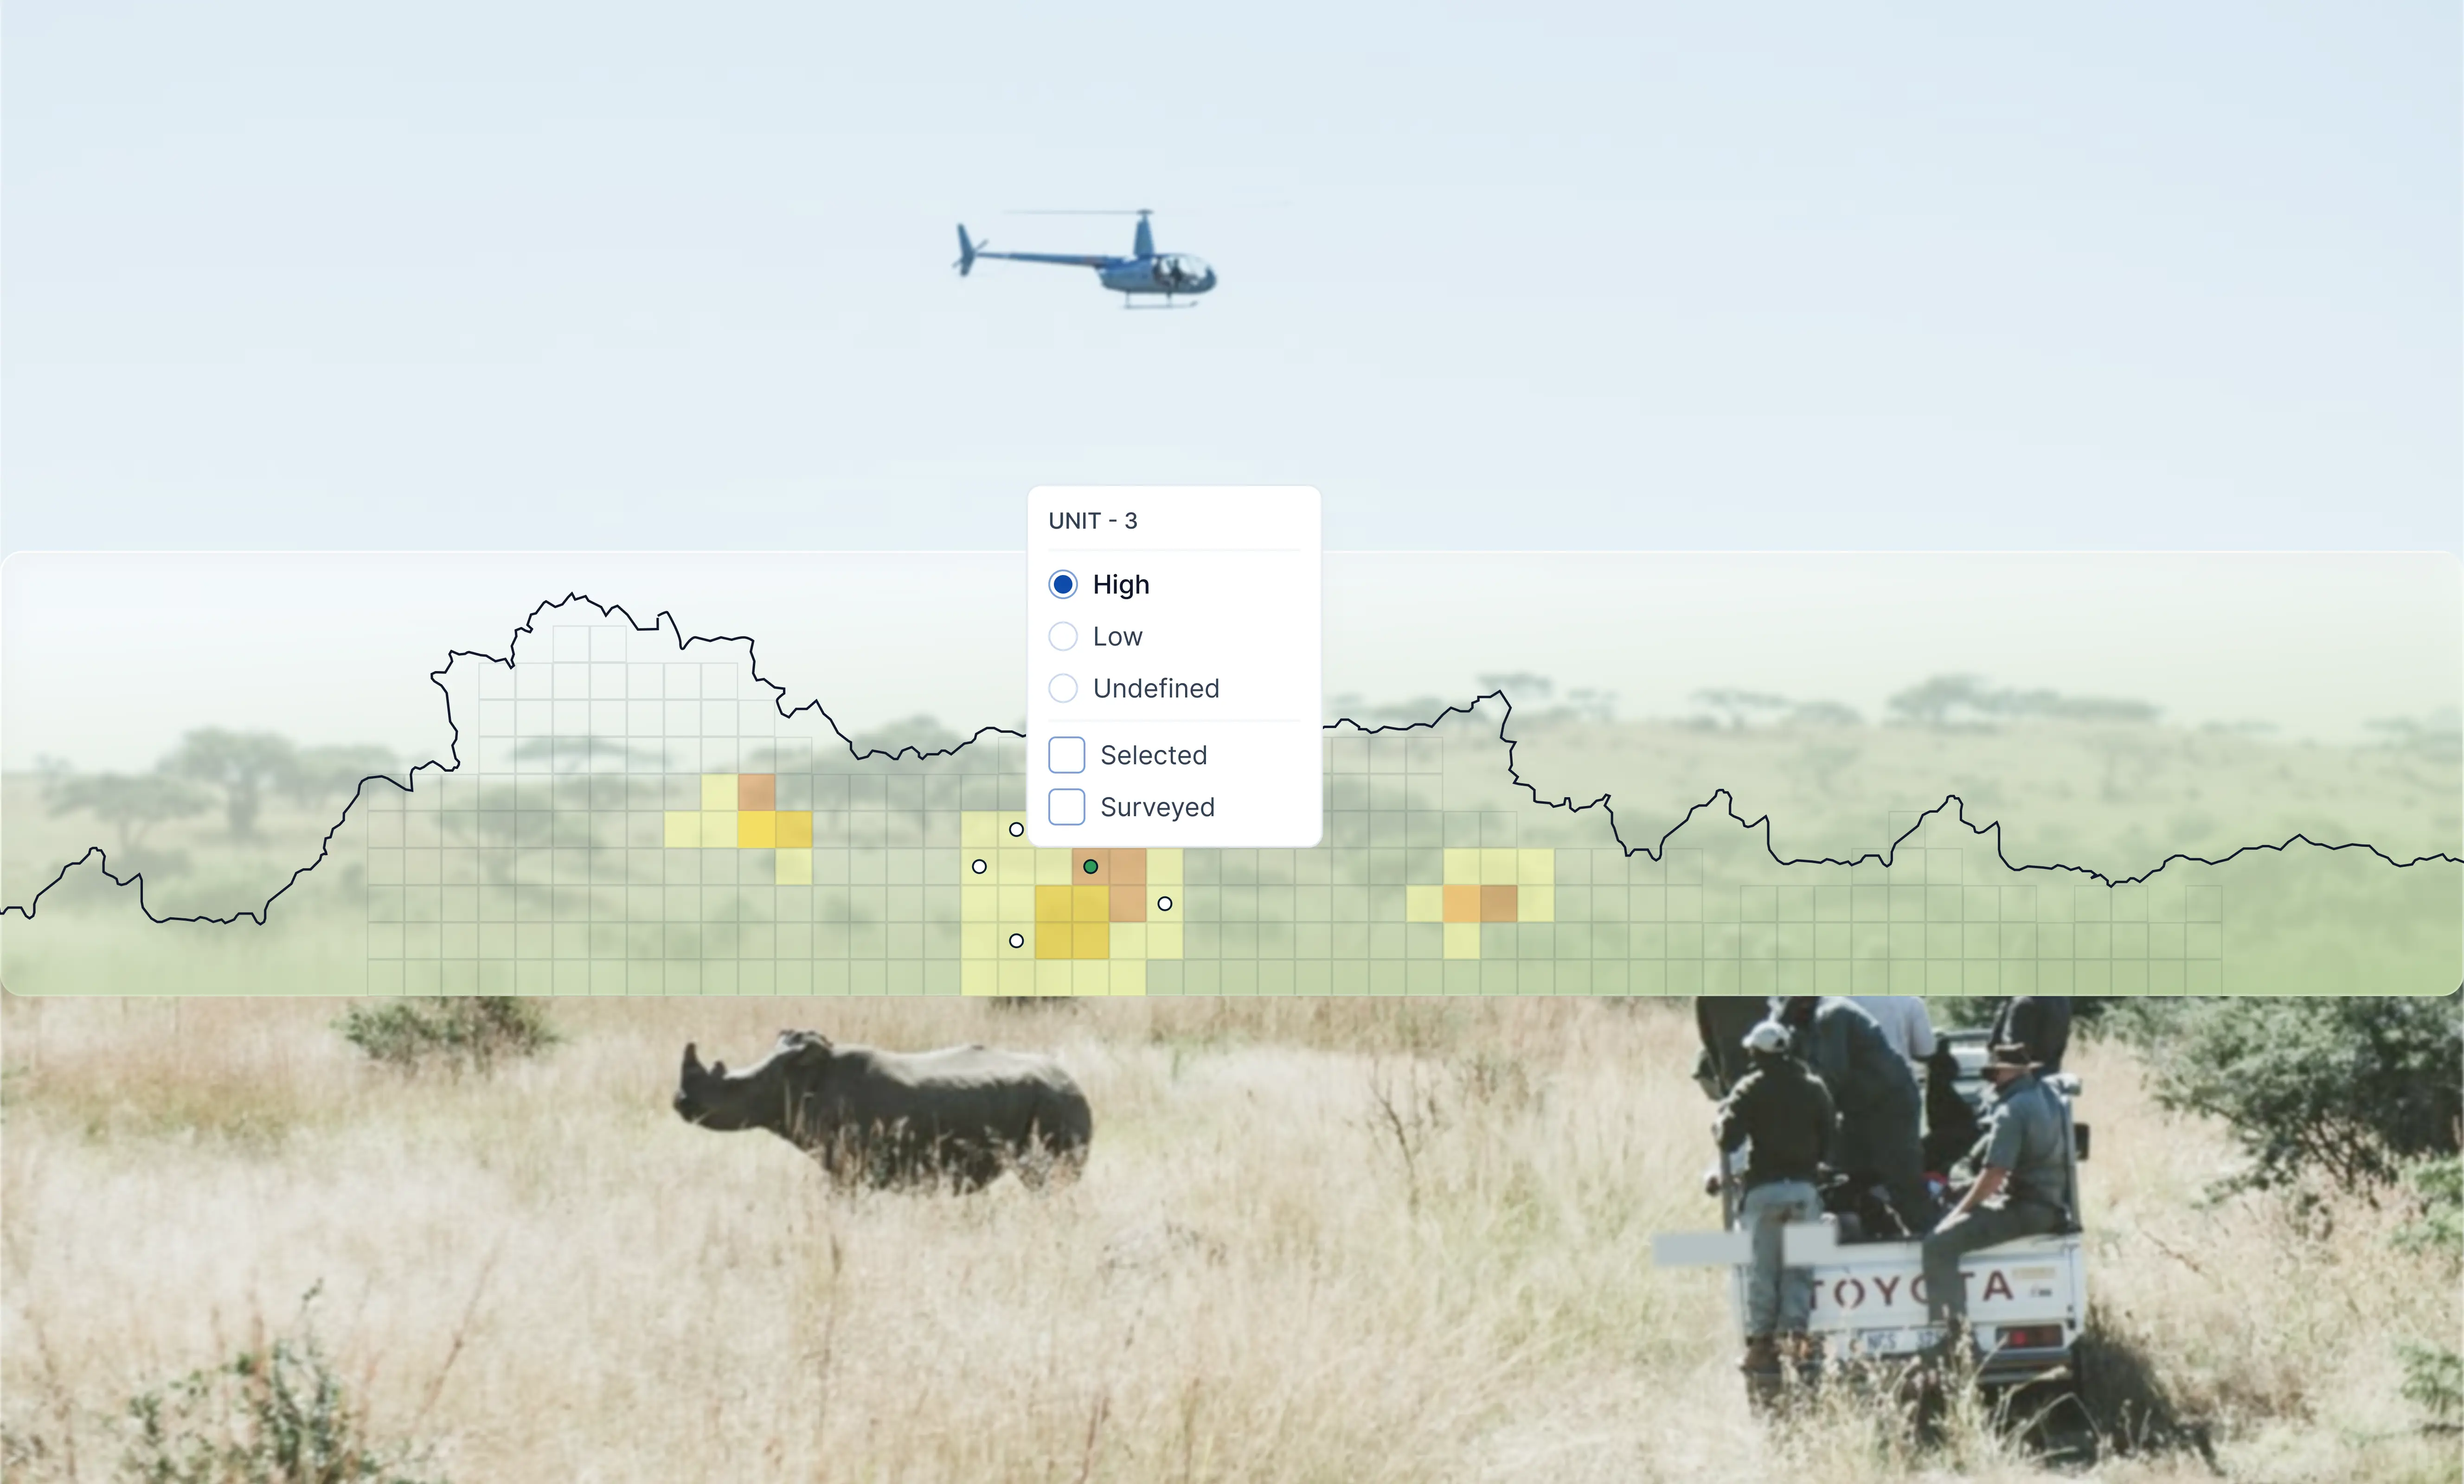
Transforming wildlife management
- 15+ years of accumulated legacy architecture and thousands of stored procedures untangled and migrated to PostgreSQL.
- ~2 seconds map rendering time (reduced from severe page freezes) achieved by compressing heavy geo.json into topo.json format delivered via Google Cloud Storage.
- Hundreds of professional biologists supported with offline tablet solutions during aerial survey flight seasons.
- 40-80% helicopter visibility variations accounted for in machine learning forecasting algorithms.
- 1,000+ permit scenarios simulated to forecast animal population dynamics and support ecological decisions.
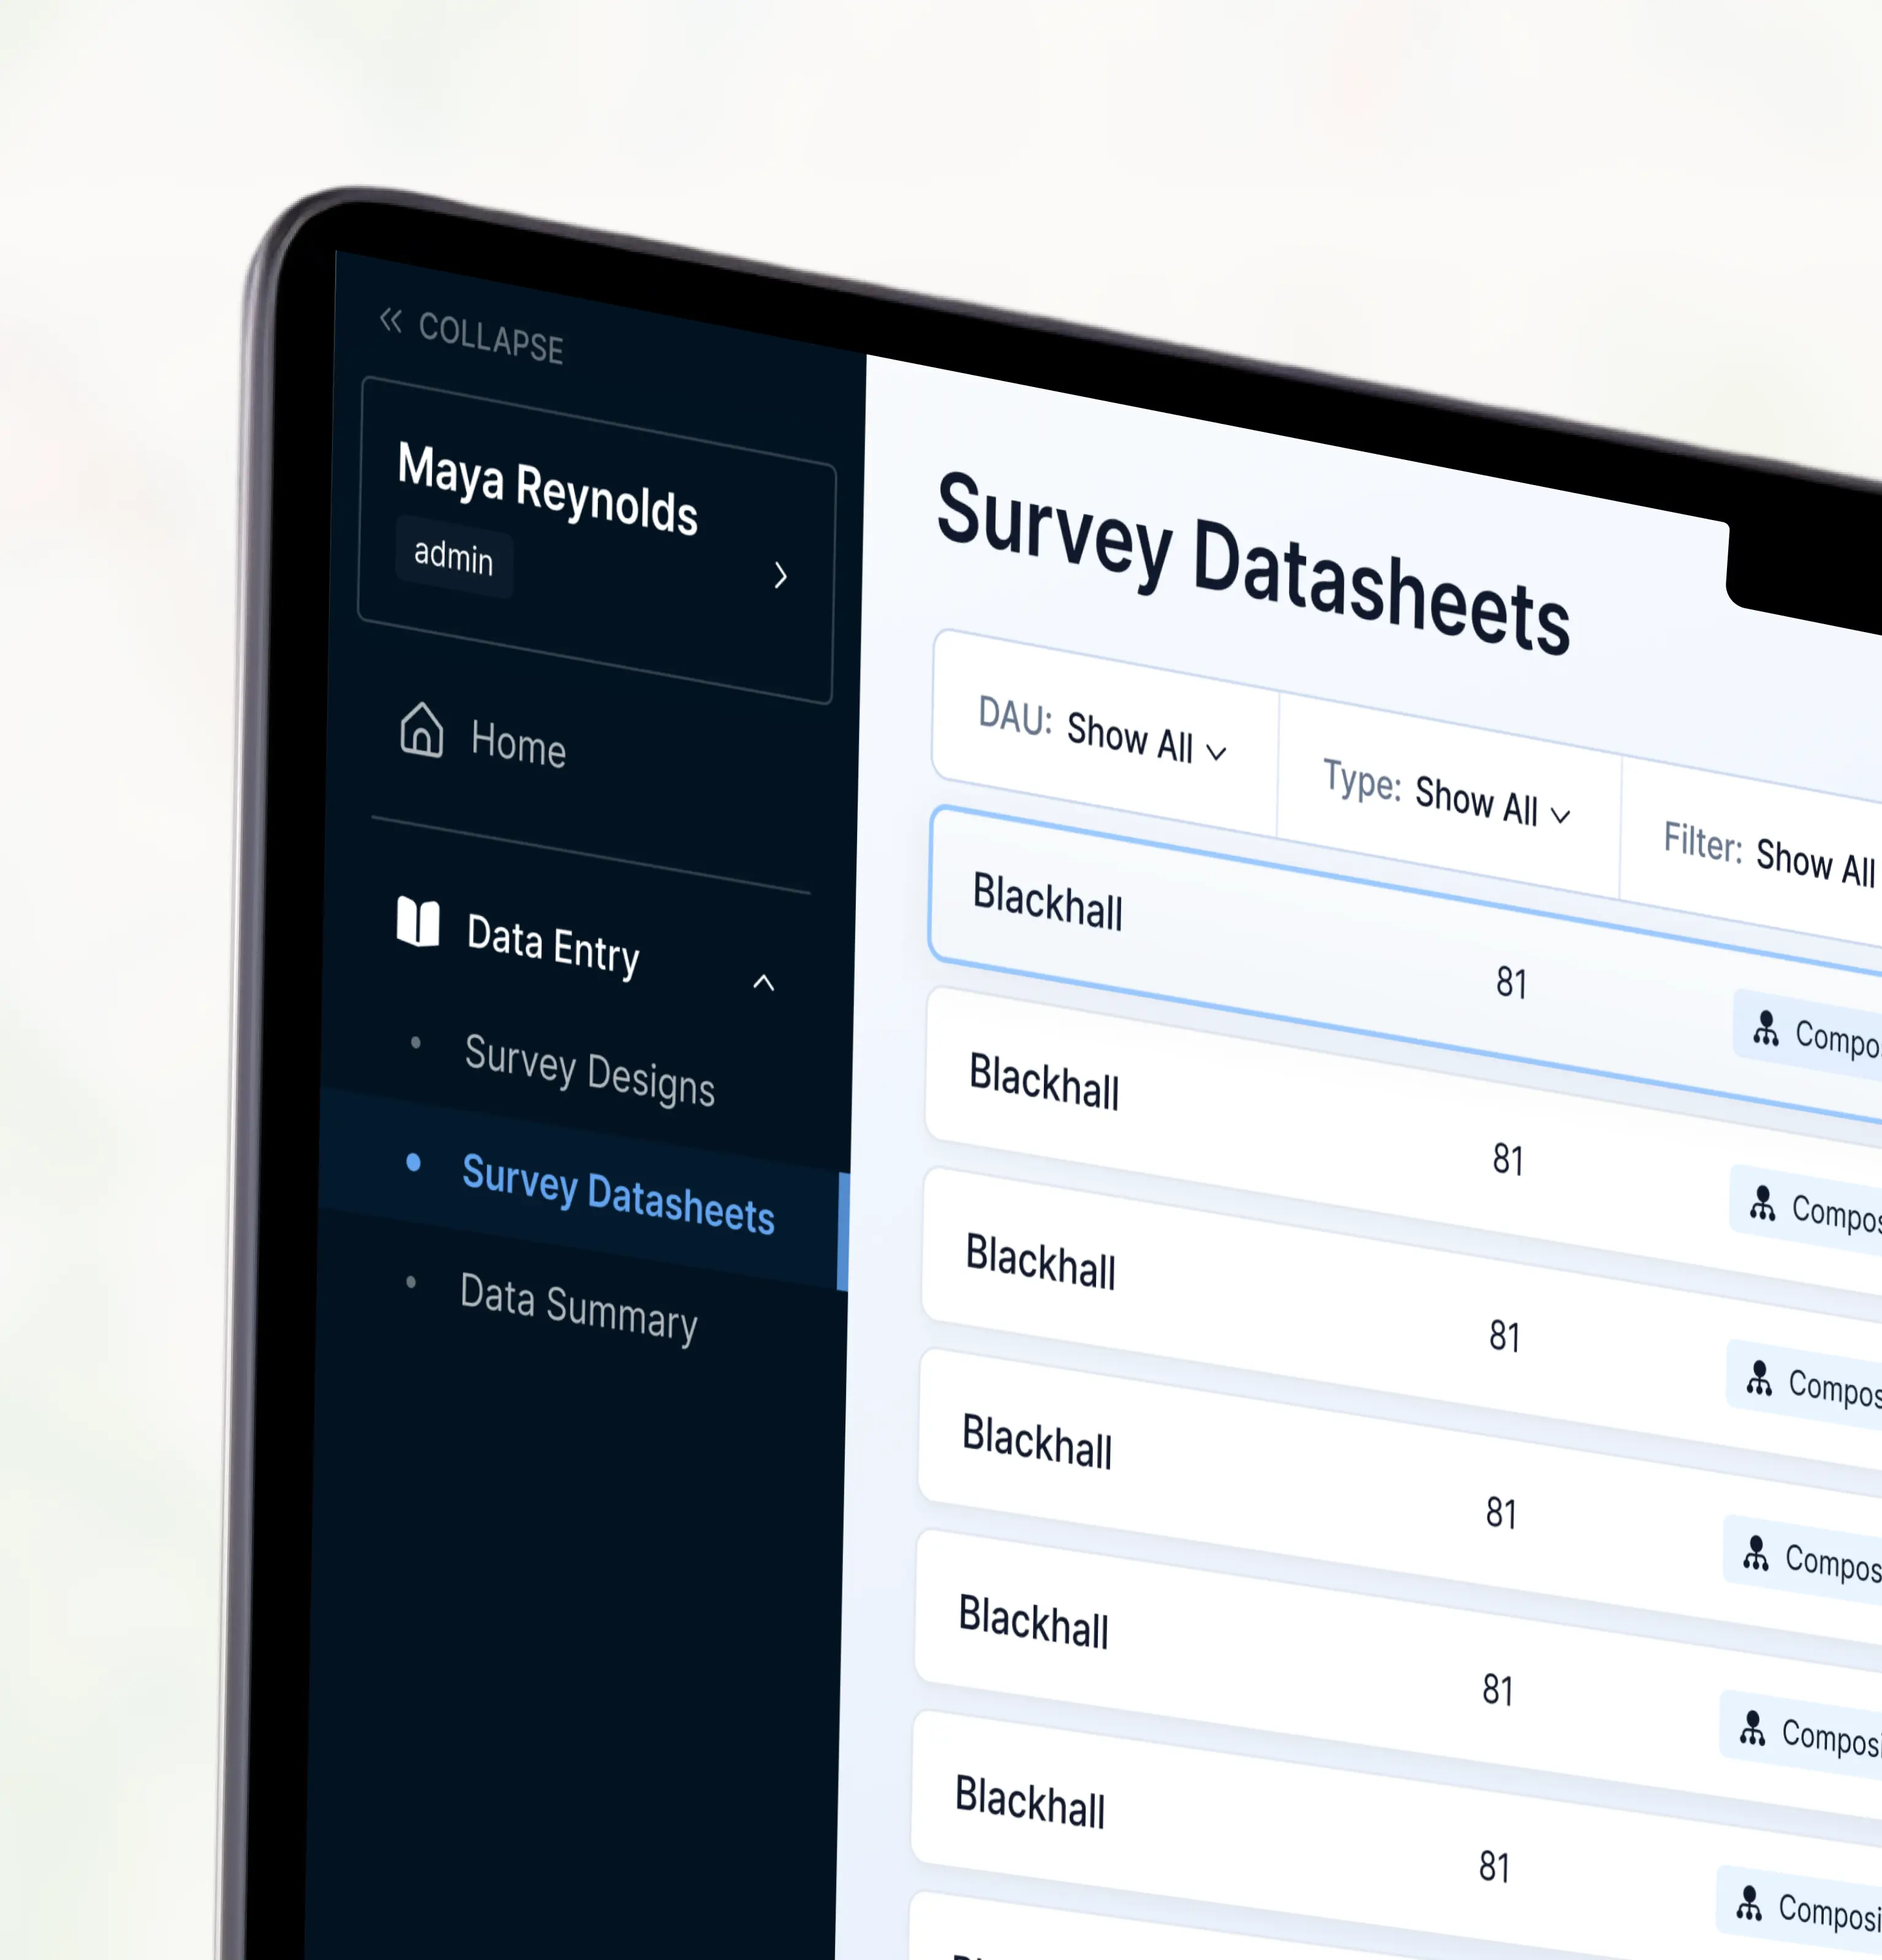

Untangling a 15-year-old legacy
The client's initial request was purely technical: to migrate away from an expensive Microsoft SQL Server database. However, the problem turned out to be much deeper.
Legacy and architectural challenges:
- The old database had been built over 10 years. It consisted of thousands of stored procedures and "views built on top of views."
- The authentication relied on database users, which caused massive inflexibility of the system.
- There was no strict data validation: you could actually save a negative number of animals.
- Data was not unified: different sets of parameters for each animal made it almost impossible to compile statewide analytics.
- The database itself also contained parts of the business logic, adding an unnecessary layer of complexity.
Solutions we implemented:
- Full migration to PostgreSQL: We moved all business logic to a modern API backend. Live data was successfully migrated and cleaned, and strict write validation was applied to the tables.
- Spatial data optimization: Previously, rendering thousands of subunits would freeze the page. We implemented background jobs: the system now calculates the map in the background, compresses heavy geo.json files into a compact topo.json format, and delivers it via Google Cloud Storage. Loading times dropped to a couple of seconds.
- Auto-generation of previews: Biologists don't have to search for specific zones by dry names; the system generates outlines of their region, so every zone is visually recognizable.
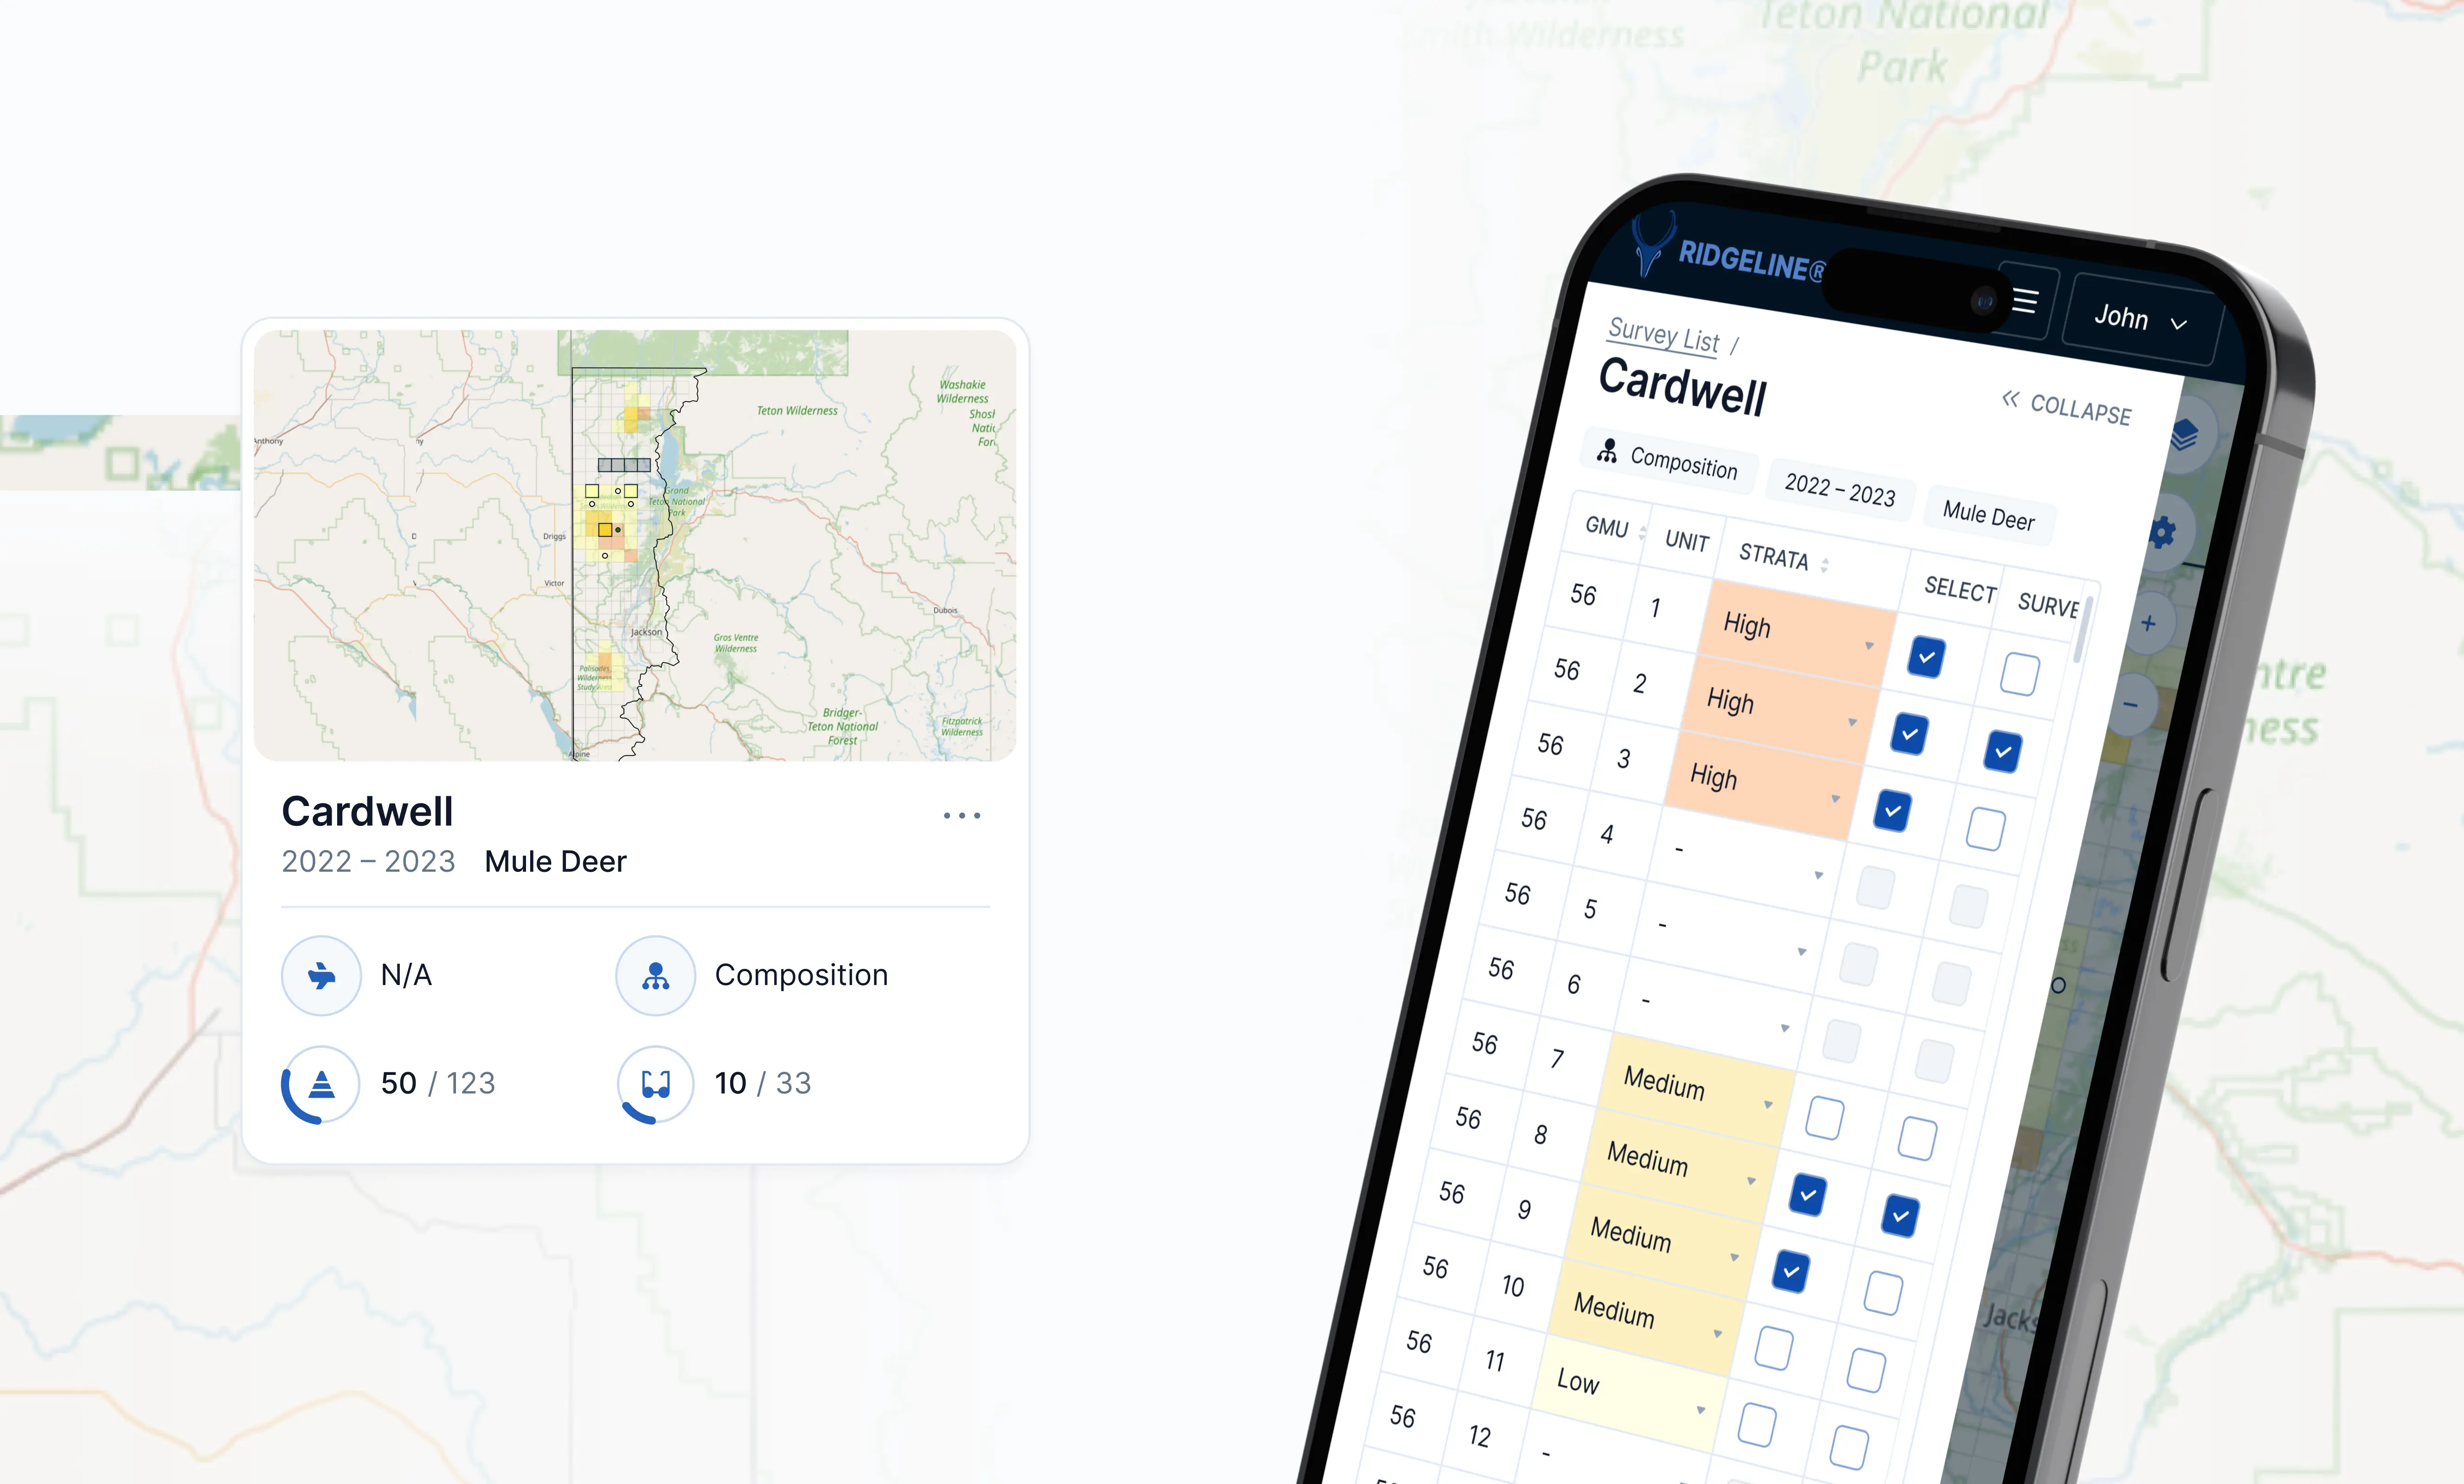
Field conditions and scientific analytics
The most interesting part of the project is the specific nature of its users' work. The system's audience is highly specialized. It consists of a few hundred professional biologists who might not log into the program for months, but during "flight season," they generate colossal amounts of data.
How the workflow operates (stratification & survey):
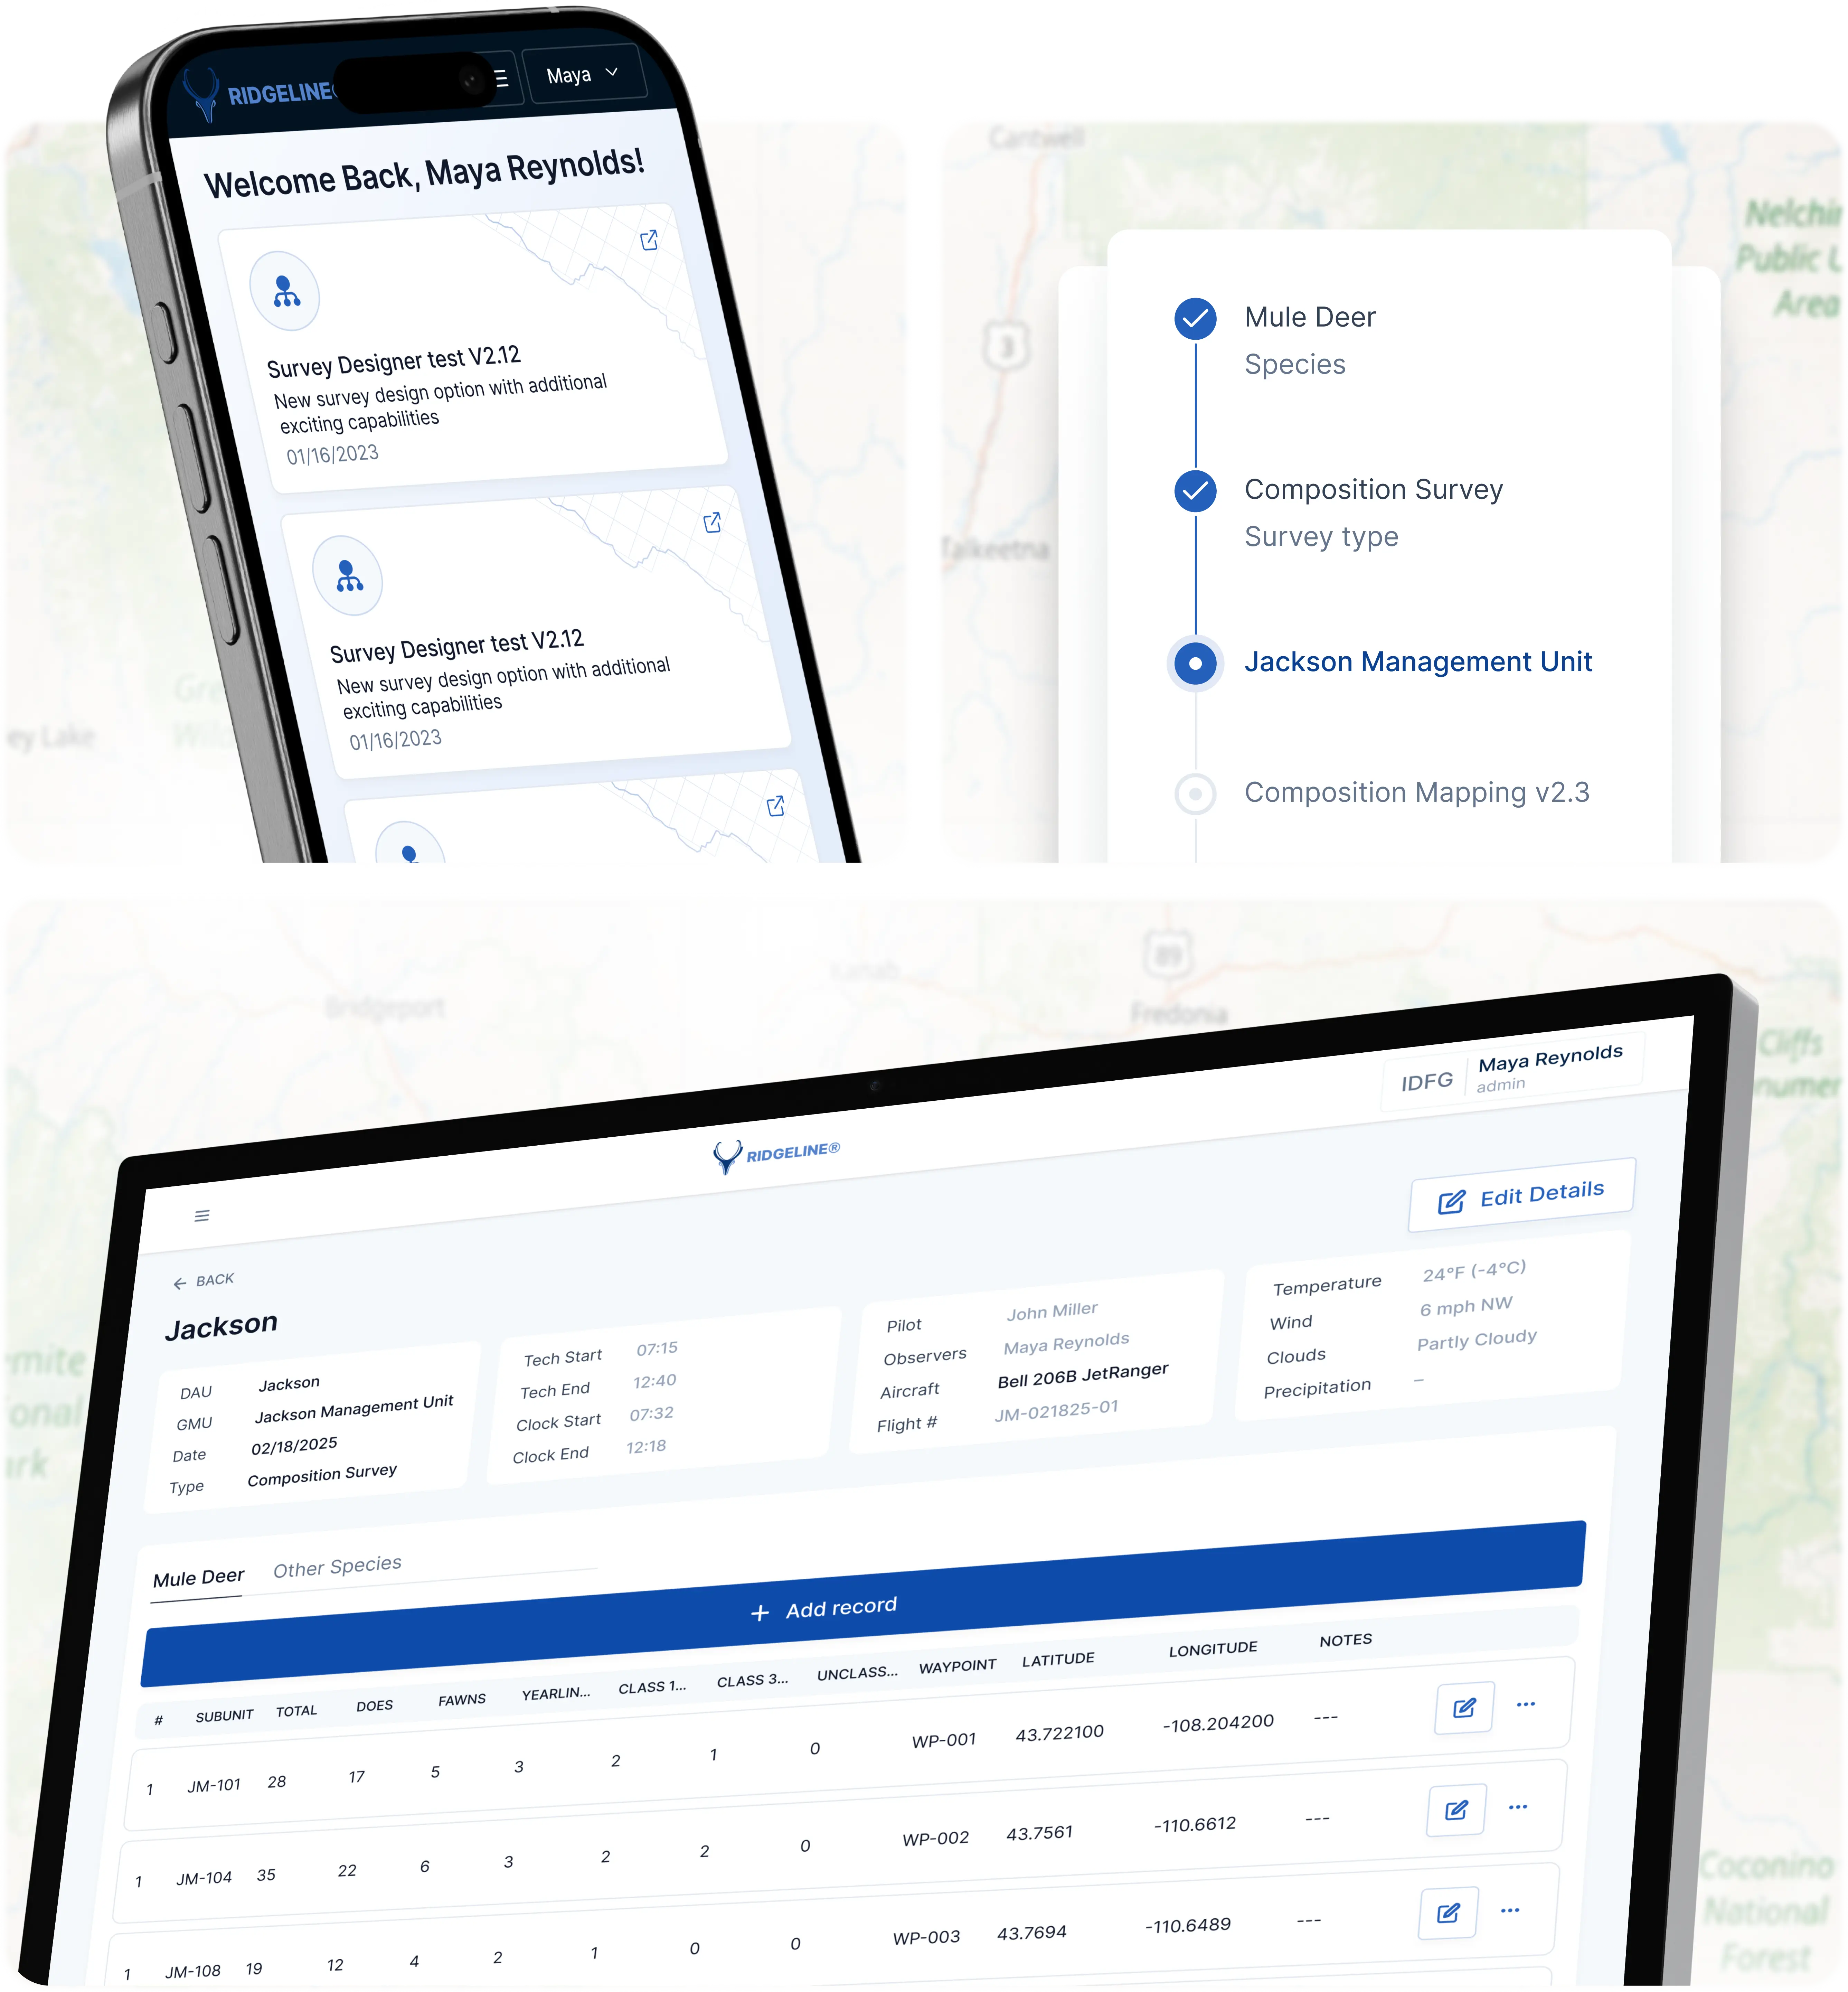
A state is divided into hierarchical zones: massive analysis units, smaller management units, and foundational grids — sub-units. Biologists tag zones based on the probability of encountering an animal ("High" or "Low" markers). Then, the system randomly selects grids for flights, ensuring the statistical purity of the sample.
From paper to offline tablets:
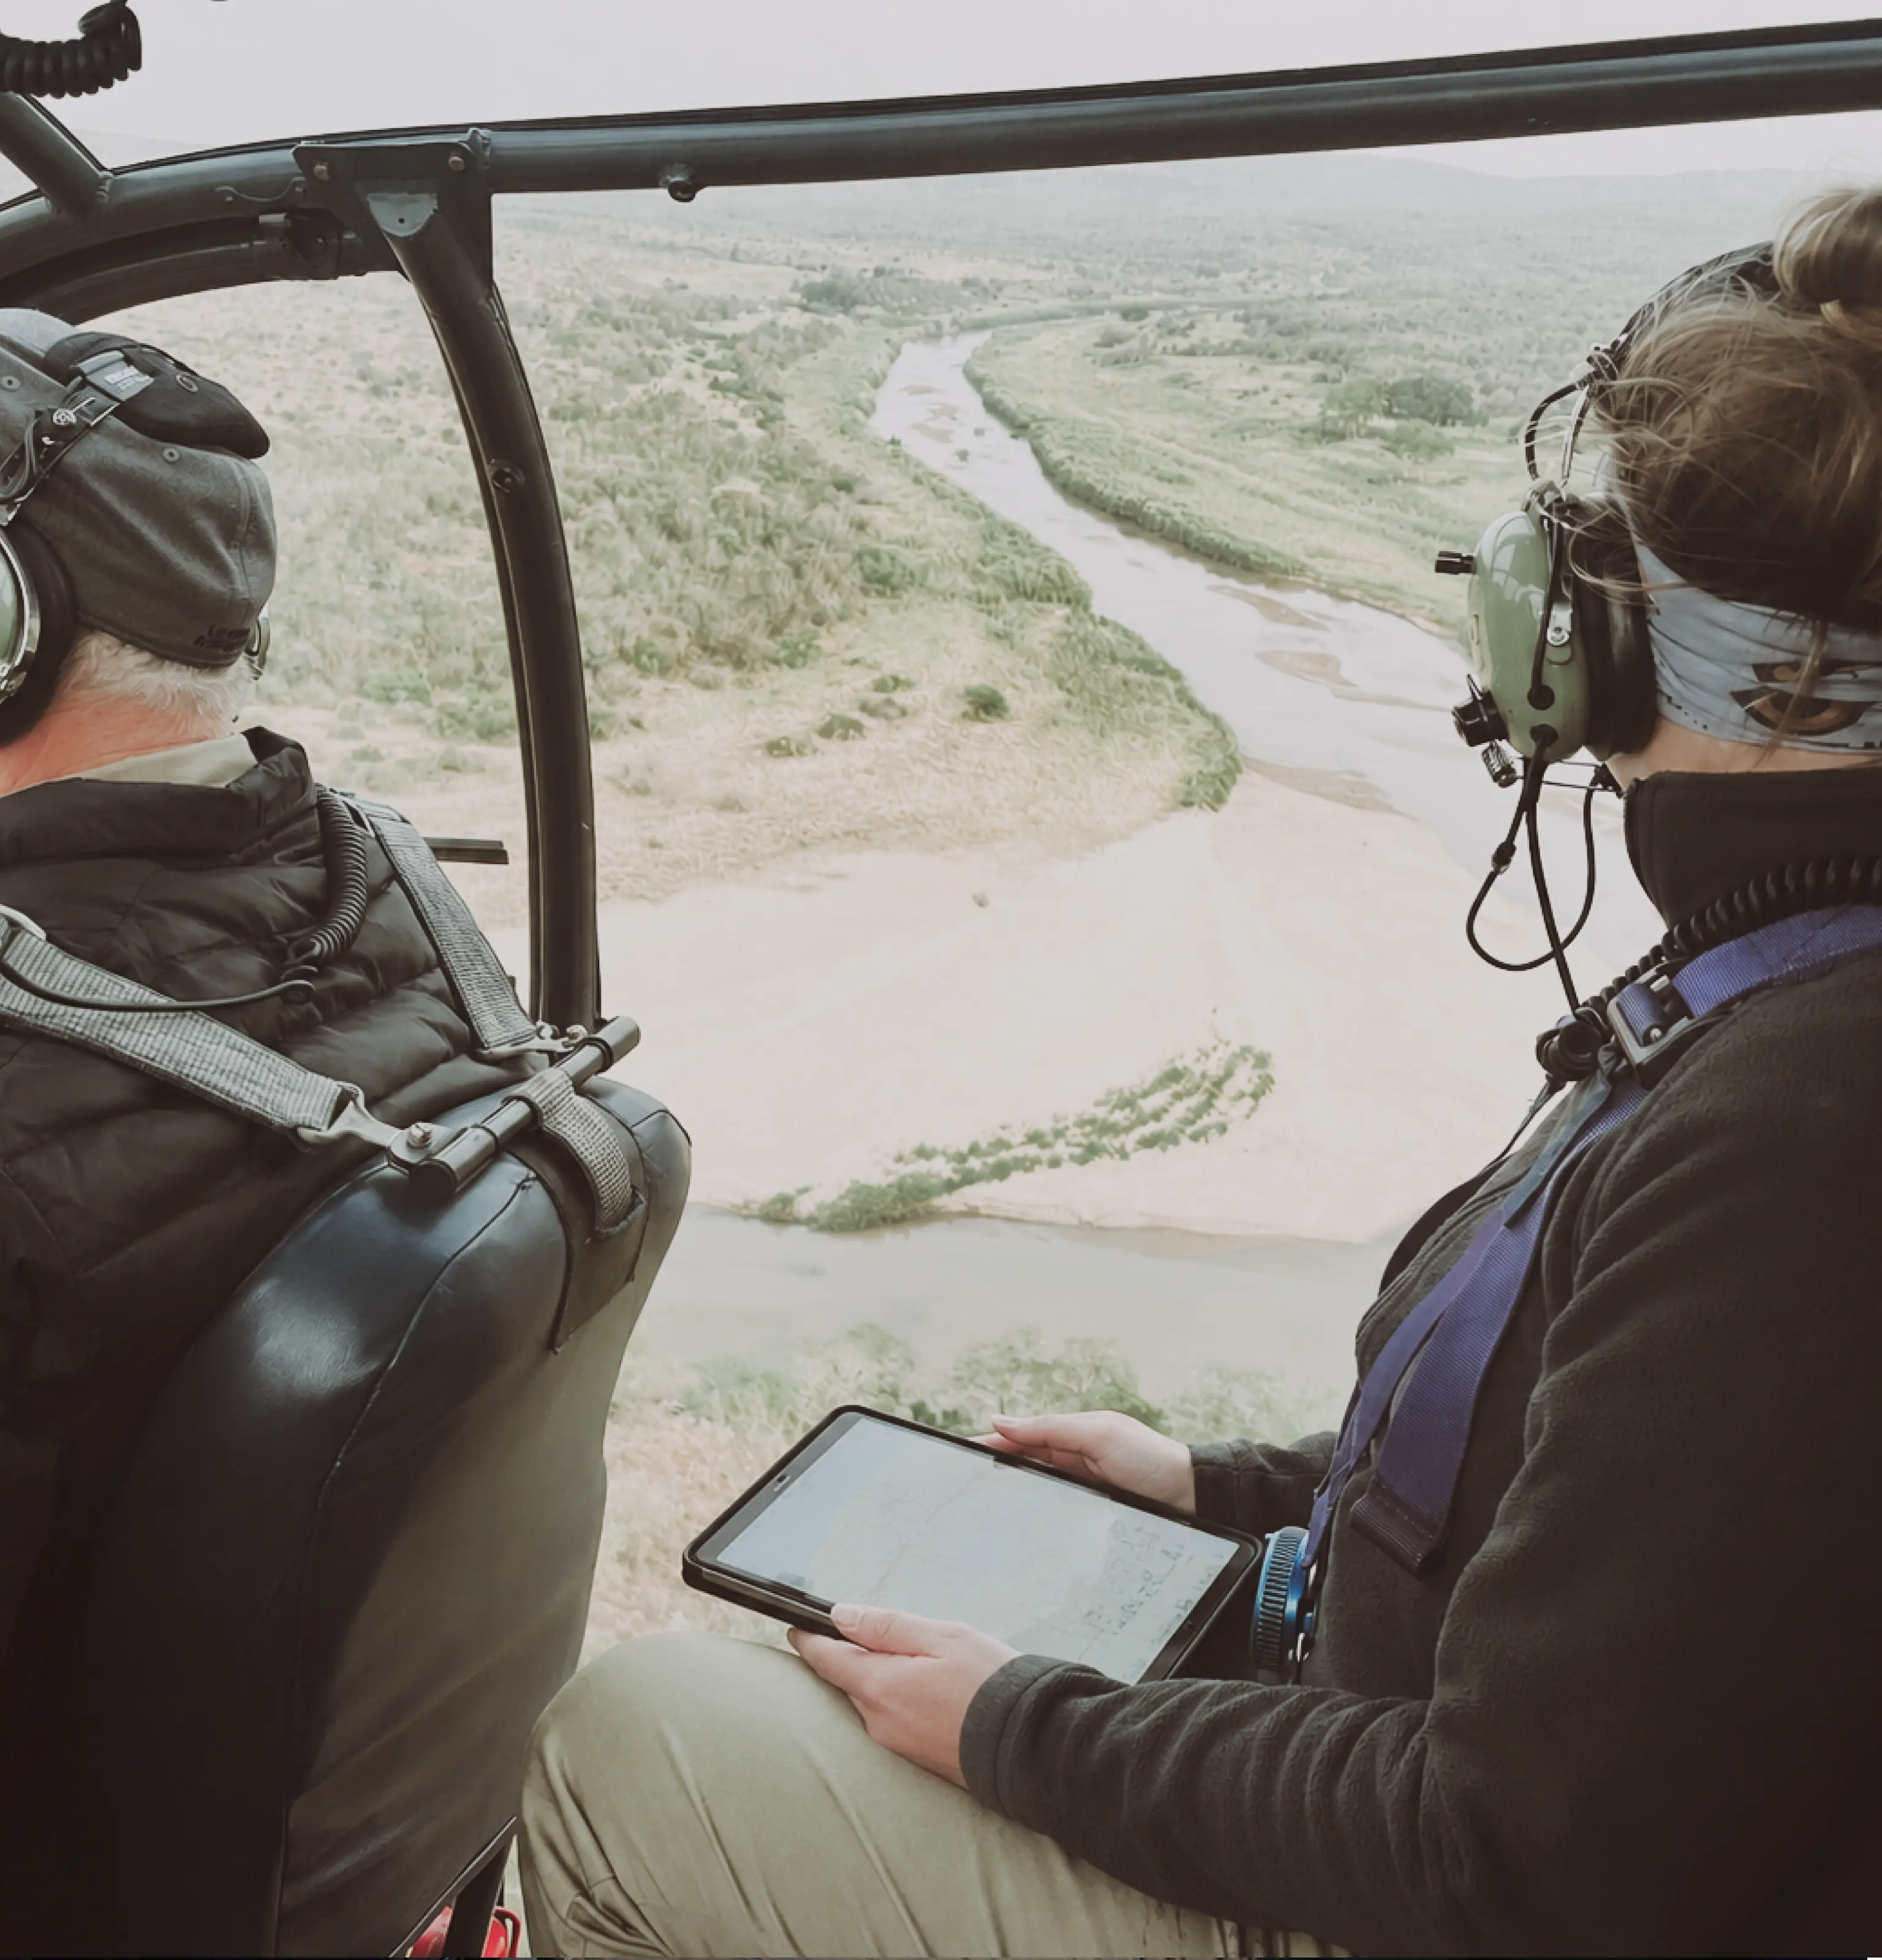
Previously, a biologist would get into a helicopter with a printed map and a paper spreadsheet. Looking out the window, they would record coordinates, count animals, and then return to the office to manually enter everything into the database.
We developed an offline mobile application for aviation. Now, right during the flight and without internet access, the biologist enters data into a tablet:
- Exact GPS coordinates of the animal group.
- Sex and age distribution (e.g., male deer are classified very specifically by the number of antler points: one point, two points, etc.).
- Current activity (animals are running, bedding, foraging).
- Terrain type (forest, sagebrush, snow levels).
Upon returning to base, the device automatically syncs the collected dataset with our server. The gathered data is then fed into statistical scripts and classic machine learning models.
Here is where the magic happens: the system accounts not just for coordinates, but for dozens of variables. For example, one helicopter model might offer 80% visibility, whereas an older model provides only 40%. Factoring in noise levels, vegetation density, and historical data from previous years, the model generates a forecast: "How many animals will there be next year if the weather is favorable, the state issues 1,000 permits, but bans hunting females?"
UX for government employees and bureaucratic constraints
The B2G (Business-to-Government) sector dictates its own rules for authorization and data isolation. We implemented OIDC (OpenID Connect) protocol integration with corporate Microsoft/Google Workspace environments. Users log in using their government emails.
Furthermore, a single email can have different roles across various state projects. The most interesting architectural solution here is Subprojects.
Imagine a government department where one division handles predators, another deer, and a third fish. They shouldn't see each other's data to prevent conflicts. We developed a system that allows access to be compartmentalized within a single state, while leaving the main administrator with full control over all branches.
.webp)
Field conditions and scientific analytics
This project breaks stereotypes about "boring and heavily bureaucratized" work with government contracts. The development process here is extremely agile. We don't work from dry technical specifications. The client gathers feedback at government meetups, brings ideas back, and the team jointly brainstorms architectural solutions. The release process is also fast and straightforward: Staging → Client Review → Production.
Planning is a distinct challenge. Because project funding is directly tied to the seasonality of government budgets (funds often arrive near the end of the state's reporting period), front-end developers are engaged periodically (part-time).
.avif)
.webp)
.webp)